
Page 110 - ACCESS ANNUAL REPORT 2019
P. 110
NOTES (continued)
A a o nts are in tho sands o hana edis n ess otherwise stated Financia ris anage ent contin ed
redit ris anage ent contin ed
E pected credit oss eas re ent contin ed
Forward oo ing in or ation incorporated in the E ode s
he assessment o SICR and the calculation o EC oth incorporate orward loo in in ormation. he Group has per ormed historical analysis and identified the ey economic varia les impactin credit ris and expected credit losses or each port olio.
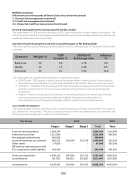
Econo ic ariab e Ass ptions and their associated i pact on D, EAD and D
he most si nificant period end assumptions used or the EC estimate as at 31 Decem er 2019 are set out elow
Scenario Weight %
GDP USD/GHC n ation rowth Exchange rate %
Base Case
50
6.8
4.78
9.8
pside
15
7.5
4.30
8.8
ownside
35
6.1
5.23
10.8
he most si nificant varia les affectin the EC model are as ollows
• GDP Growth GDP rowth is used to assess the relative health o the economy. orward loo in
in ormation is incorporated y usin the pro ected GDP rowth rate or the current year as a ase.
• SD G C he Ban o Ghana avera e SD rate on the date o assessment and or the last three
uarters is used in the tool. his is ecause o the sensitivity o the economy to exchan e rate
uctuations.
• In ation In ation is used due to its in uence on monetary policy and on interest rates. Interest
rates has an impact on orrowers’ li elihood o de ault. orward loo in in ormation is incorporated y usin the expected chan e in in ation rates or the next three uarters.
redit ris e pos re
he ollowin ta le contains an analysis o the credit ris exposure o financial instruments or which an EC allowance is reco nised. he ross carryin amount o financial assets elow also represent the Group’s maximum exposure to credit ris on these assets.
he ro p 2019 2018
Stage 1 Stage 2 Stage
ota
ota
ash and cash e uiva ents nvestment securities
on p edged trading ssets oans and advances to customers ther assets
a ance sheet e posures with recogni ed in other ia i ities
1,094,344 1,351,980
543,430
600,000 902,323
209,590 322,736 97,058
, , , , , , , ,
,
1,516,990 866,065 815,559 205,188
661,993
ross carrying amount 4,589,135 209,590 322,736 oss a owance (19,753) (69,661) (63,033)
, , ,
4,065,301 (193,365)
oss a owance 4,569,382 139,929 259,703
, ,
4,055,364
109
